Product: Quark Docurated (QD)
This document will help the reader understand the Activity Report in the Analytics tab.
- Go to the left window section and click on Analytics.
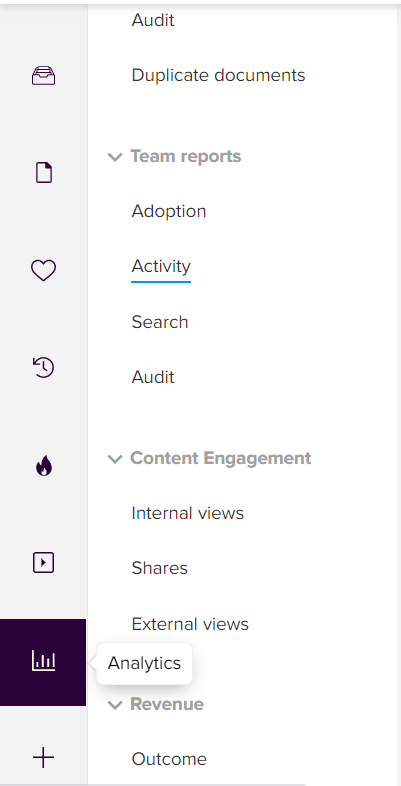
- Further, go to Team Reports > Activity.
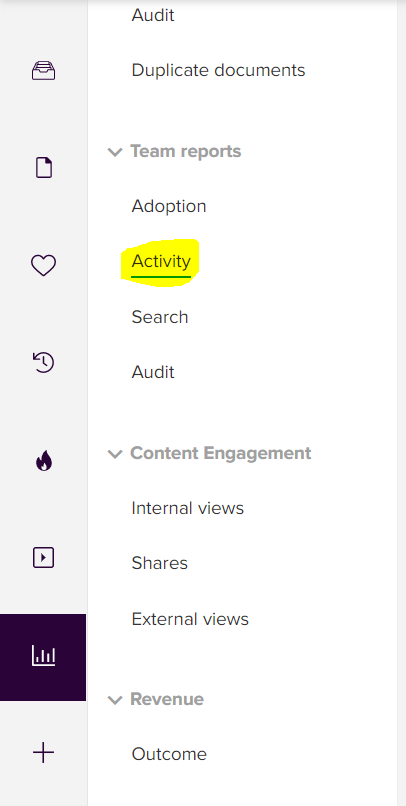
- After going to the Activity report, multiple sections appear will appear depicting the various parameters for the dedicated account.
- The filters option will enable user to filter the data using parameters such as - Selecting the time range, groups, user name(s), content type or activity.
- The data in the report below will vary w.r.t. the parameters in the filters.

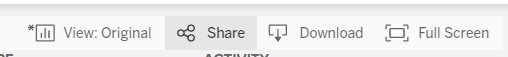
- Below are general options that can help undo action, redo action, revert to previous action, download report, or pause report generation.

- User can also use these options to download the report, view it in full screen, share or save report version/format.
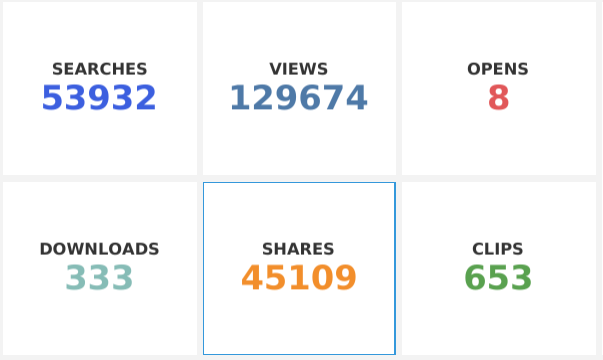
- The below section will help check the various aspects for the account such as how many searches are done, views for documents, documents opened, file downloads, files shared and how many files/pages have been clipped.
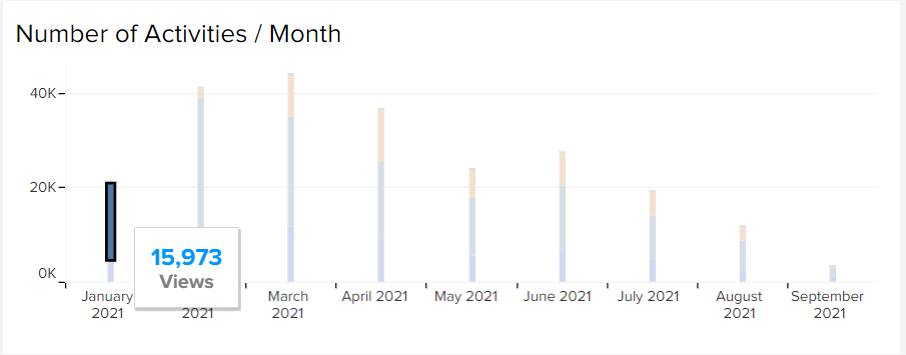
- This report will help check the activities done by the account users’ month-wise.
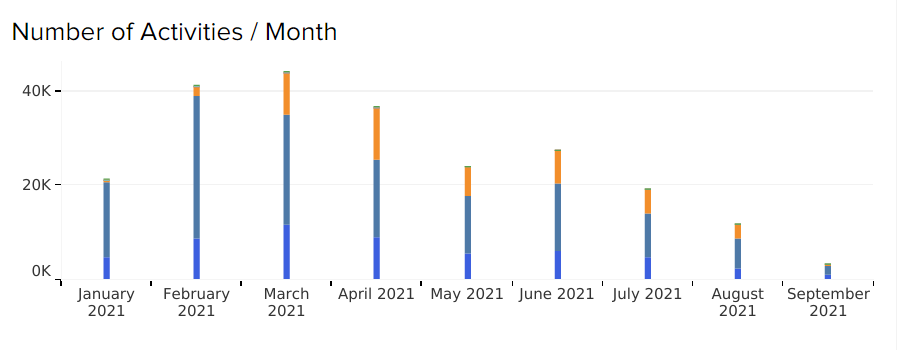
- Different colours in the bars suggest different activities, and these are clickable for individual reference.
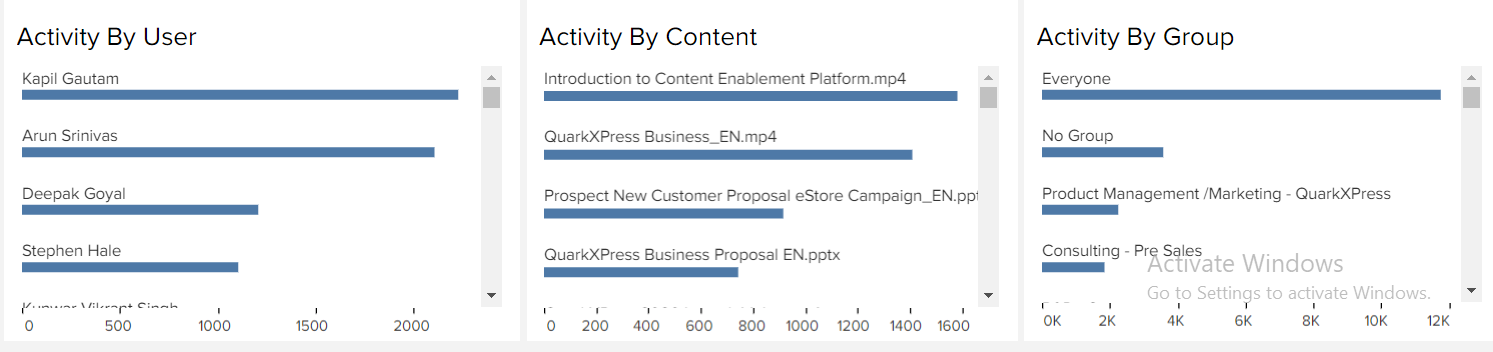
- This section will allow to view activities done by individual user, activity done by content and activity done by group from highest to lowest.
Priyanka Bhotika
Comments