Product: Quark Docurated (QD)
This document will help the reader understand the Adoption Report in the Analytics tab.
- Go to the left window section and click on Analytics.
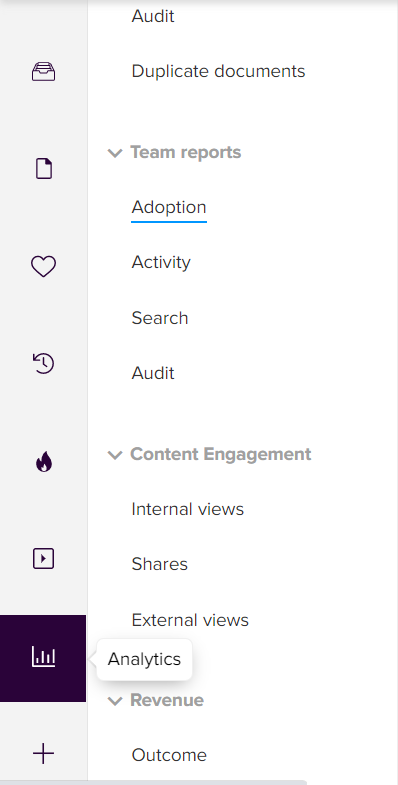
- Further, go to Team Reports > Adoption.
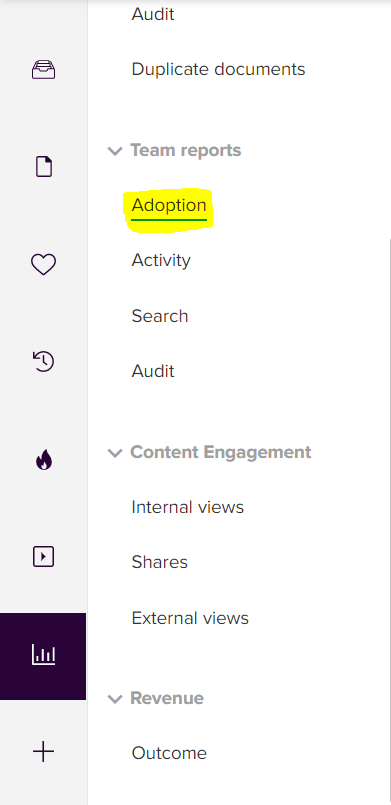
- After going to the Adoption report, multiple sections appear will appear depicting the various parameters for the dedicated account.
- The filters option will enable user to filter the data using parameters such as - Selecting the time range & groups.
- The data in the report below will vary w.r.t. the parameters in the filters.

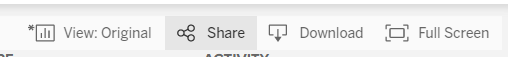
- Below are general options that can help undo action, redo action, revert to previous action, download report, or pause report generation.

- User can also use these options to download the report, view it in full screen, share or save report version/format.
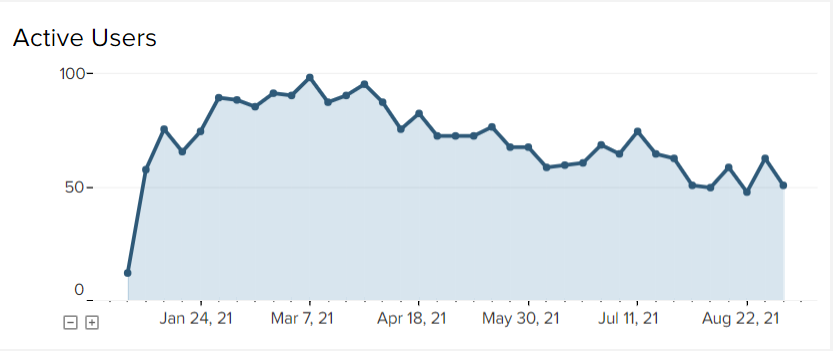
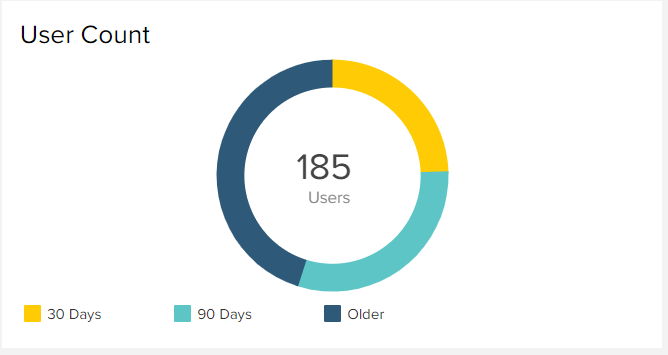
- This graph will show the trend of users who have actively logged in to their QD account.
- This section will depict the users that have logged in QD in the past 30 days, in the past 90 days and users that have logged in older than 90 days.
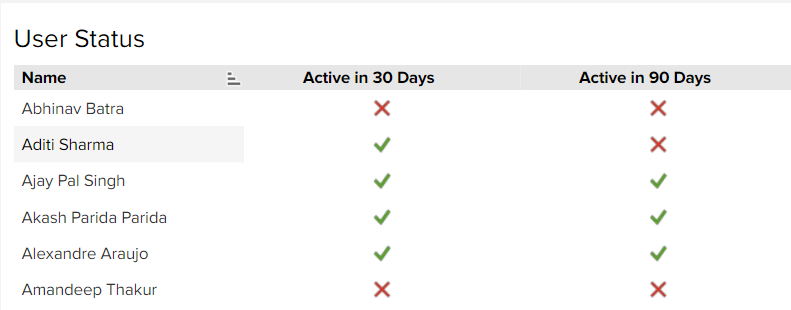
- This report shows further detail on which user has logged-in in past 30 days or past 90 days.
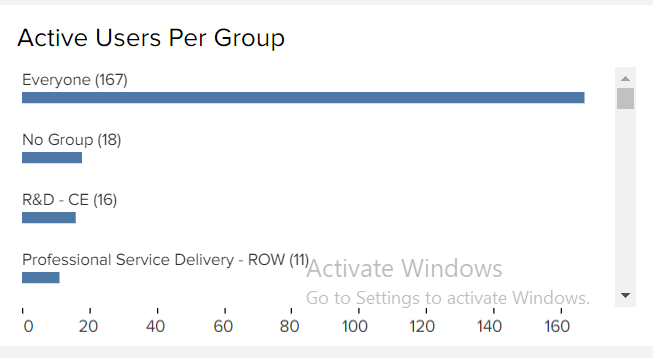
- Active Users by Group report will show activity of users w.r.t group.
Priyanka Bhotika
Comments